Aggregate results of Active Region distribution (2007 - Dec 2025)
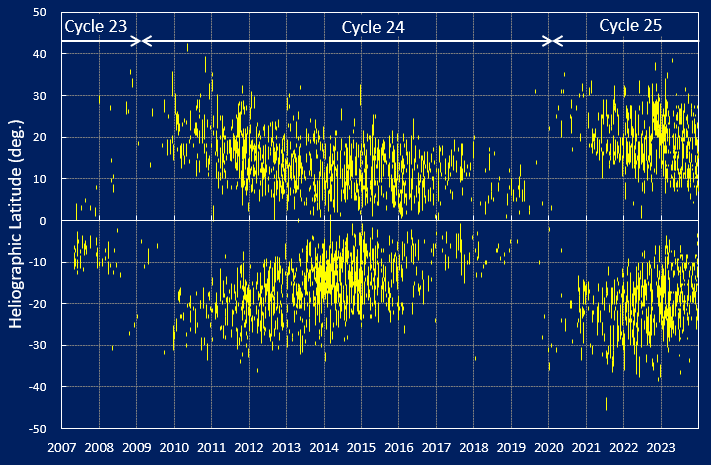
 Fig. 1 Appeared latitude-aging of solar active regions (Butterfly diagram)
 (from May 2007 to Dec 2025)
Fig. 1 shows the aging of appeared heliographic latitude of all solar active regions in the solar cycle from 23 to 25*.
Each region is indicated with a yellow bar, the length of bar represents the maximum spread of north-south direction in the heliographic latitude.
It has a feature that the solar active region begins to appear in higher latitude over 20 degrees at the initial period of an about 11-year solar cycle 24, and moves to lower latitude gradually.
The figure is generally called the "Butterfly diagram" because it seems spread butterfly wings.
In 2007 and 2008, we can detect regions in lower latitude belonging to a previous solar cycle 23 and higher-latitude regions of cycle 24 simultaneously.
You can detect that some high-latitude sunspot groups belonging to the next cycle 25 started to appear from the latter half of 2019,
and the acticities get into full swing in 2021.
Changeover swith of figure
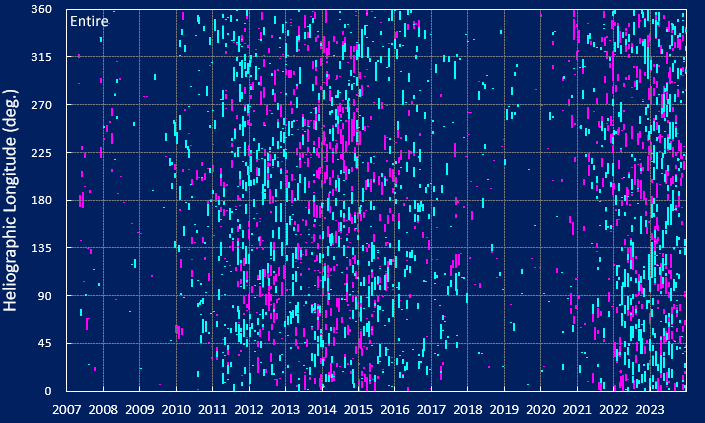
 Fig. 2 Appeared longitude-aging of solar active regions
 (from May 2007 to Dec 2025)
Cyan... Northern hemisphere, Magenta... Southern hemisphere
Fig. 2 shows the aging of appeared heliographic longitude of all solar active regions in the solar cycle from 23 to 25*.
Regions in northern and southern hemispheres are indicated with cyan and magenta bars respectively, the length of bar represents the maximum spread of east-west direction in the heliographic longitude.
You can switch the figure including only northern or southern hemispheres, and latitude range of appeared regions by clicking on buttons at the upper of figure.
Although the appeared longitude of solar active region is seemingly at random, this result shows that some empty regions where almost no active regions appeared can be recognized in a mottled distribution.
Changeover swith of displayed year
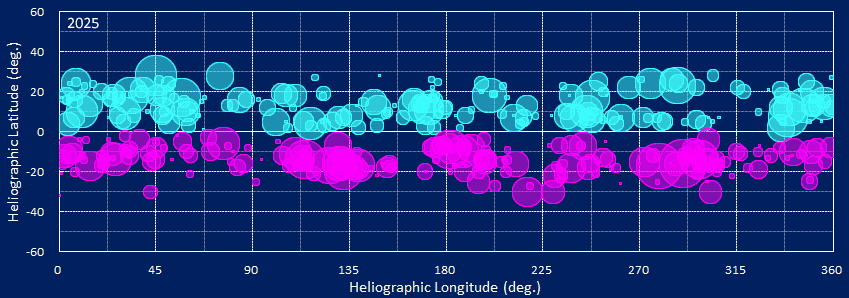
 Fig. 3 Year-display of solar active regions
Fig. 3 plotted all active regions in individual years on expanded longitude and latitude view.
Diameters of circles that represent individual active regions denote the maximum spread of east-west direction in the heliographic longitude.
You can comprehend the change of appeared latitude of individual active regions from higher to lower by switching the displaying year from 2007 to 2025 by clicking on buttons at the upper of figure.
* Serial cycle number from the cycle 1 during 1755 through 1766 decided from an about 11-year cycled sunspot activity since 1755.
This individual observed result has no garantee of reliability by any public sector organizations.


