Observed Spectral profile of NGC7293


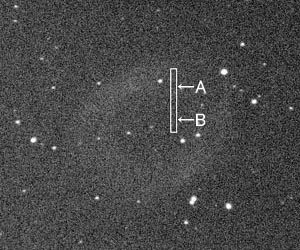
Slit position (north in up)

A & B indicate positions of two profiles below

A: Profile of ring part of NGC7293, B: Profile of hollow part

Date Time: Sep 28 2013, from 25:11 to 25:14 JST(+0900)
Composed 2 shots with 3 minutes exposed
Optical: TAKAHASHI 12.5cm(4.9") fluorite refractor, stopped D=100mm (f=1000mm, F10.0)
with SBIG DSS7 Spectrometer
Auto-guided with VIXEN ATLUX Equatorial
Cooled CCD Camera: SBIG ST-402ME (Temp.: -10°C)
Location: Ooizumi, Hokuto city, Yamanashi pref.

Upper strip: taken spectrogram, Lower strip: stretched 3-pixel-width & pseudo-colored image
Magnified profiles around Hα line
(Upper: Ring part, Lower: Hollow part)
Solid circle: Observed intensities
Megenta: Gaussian curves of Hα & N II lines
Yellow: Overlay of the Gaussians


This page shows you the observed spectral profile of NGC7293 (Helix nebula) taken with a spectrometer. Two sets of profiles are equivalent to "ring" (A part indicated with white line) and "hollow" (B part with yellow line) parts of the nebula, indicated in an optical image in upper left hand side.
Although the spectral image has lower S/N in shorter wavelength region due to lower surface brightness of the nebula, we can detect clear emission lines of H-alpha, H-beta of the Balmer series of hydrogen atoms and ionized oxygen atoms of O III. Clear differences cannot be recognized between two parts in characteristics of emission lines of O III and H-beta, but we can detect a striking difference around H-alpha line. There are two neighboring emission lines from ionized nitrogen atoms of N II (at 6548Å and 6583Å). The N II lines are predominant in the ring part (A part) of NGC7293, while the profile of the hollow part (B part) shows that the intensity of H-alpha line looks being far superior to those of N II lines.
The magnified spectral profiles of two parts of the nebula around the wavelength of H-alpha line are shown in the right hand side paralleled vertically. The profiles show calculated intensities as solid curves fitted to observed ones under an assumption that individual emission lines have the Gaussian distribution with a standard deviation, σ =8Å. The strength of H-alpha lines in both parts have about 1000 counts, while it can be recognized that the strength of N II lines have large differences between two parts of the nebula. Those differences suggest us that the ionized hydrogen and oxygen atoms, emitting H-alpha and O III lines are distributed globular in the nebula, while the ionized nitrogen atoms, emitting N II lines are concentrated in spherical shell. Almost same tendency can be observed in the spectral characteristics of the Ring nebula (M57) in Lyra.


Close the window Copyright(c) 2013 by Naoyuki Kurita, All rights reserved.