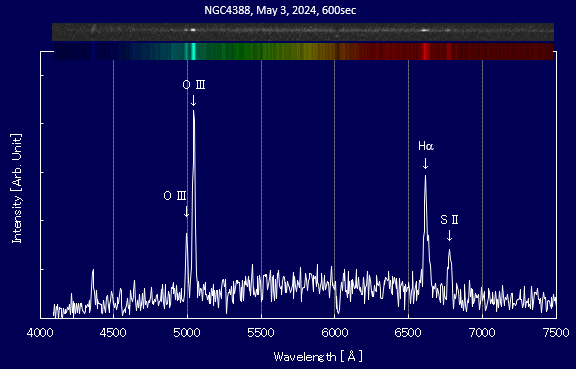
Upper strip: taken spectrogram, Lower strip: stretched 3-pixel-width & pseudo-colored image
| Emission line | Hα | S II | O III | O III |
|---|
| Observed WL, λm | 6614 Å | 6779 Å | 4994 Å | 5043 Å |
| WL in literature, λ0 | 6562.9 Å | 6730 Å | 4959 Å | 5007 Å |
| Red shift, z | 7.786×10⁻³ | 7.281×10⁻³ | 7.058×10⁻³ | 7.190×10⁻³ |
| Recession velocity, v | 2327 km/s | 2176 km/s | 2110 km/s | 2149 km/s |
z= (λm-λ0)/λ0
v= c*((1+z)2-1)/((1+z)2+1) (c: velocity of light)
|
This is a spectrum obtained from the central region of the Seyfert galaxy NGC4388, showing the intensity distribution of wavelengths.
The profile includes emission lines from hydrogen atoms (Hα line), ionized oxygen, and ionized sulfur, originating from the interstellar gas within the galaxy's active region.
The table on the right indicates the recession velocity of NGC4388, determined from the redshift of these wavelengths.
The average value of the four emission lines is approximately 2190 km/s. Using the Hubble constant H0=70 km/s/Mpc, the distance is estimated to be about 100 million light-years.
However, it is actually known to be 57 million light-years. This discrepancy is mainly due to the significant influence of the local motion components of individual galaxies within the Virgo Cluster.
|

