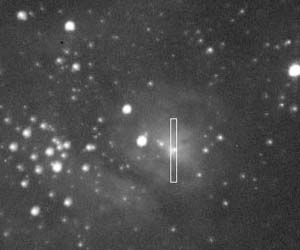

| Date & Time: | Sep 28 2013, from 19:45 JST(+0900), 2min. exposed |
| Optical: | TAKAHASHI 12.5cm(4.9") fluorite refractor, stopped D=100mm (f=1000mm, F10.0) |
| with SBIG DSS7 Spectrometer | |
| Auto-guided with VIXEN ATLUX Equatorial | |
| Cooled CCD Camera: | SBIG ST-402ME (Temp.: -10°C) |
| Location: | Ooizumi, Hokuto city, Yamanashi pref. |
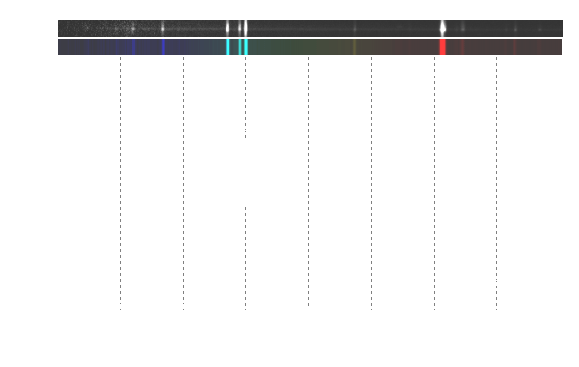
Upper strip: taken spectrogram, Lower strip: stretched 3-pixel-width & pseudo-colored image
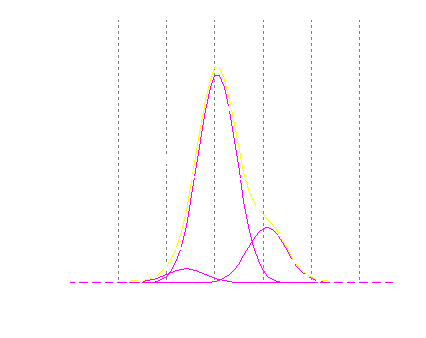
Magnified profile around Hα line
Solid circle: Observed intensities
Megenta: Gaussian curves of Hα & N II lines
Yellow: Overlay of the Gaussians
