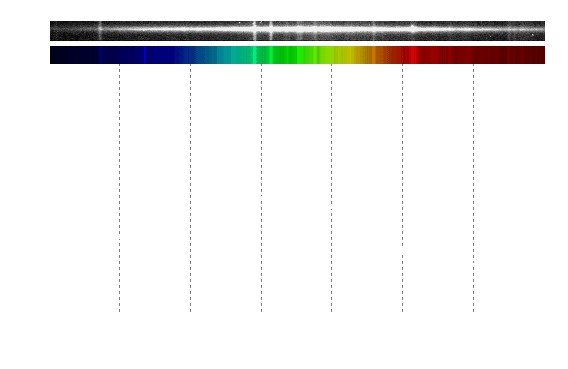
Observed Spectral profile of M51
| Date & Time: | Dec 22 2011, from 27:49 to 27:59 JST(+0900) |
| Composed 2 shots with 10 minutes exposed |
| Optical: | Meade 25cm(10") Schmidt Cassegrain (f=2500mm, F10.0) |
| with SBIG DSS7 Spectrometer |
| Auto-guided with Meade LX200 Equatorial & Pictor 201 XT |
| Cooled CCD Camera: | SBIG ST-402ME (Temp.: -25°C) |
| Location: | Ooizumi, Hokuto city, Yamanashi pref. |
Upper strip: taken spectrogram, Lower strip: stretched 3-pixel-width & pseudo-colored image
| Emission line | Hα | N II |
|---|
| Observed WL, λm | 6568.5 Å | 6590.0 Å |
| WL in literature, λ0 | 6562.9 Å | 6584 Å |
| Red shift, z | 8.61×10⁻⁴ | 9.11×10⁻⁴ |
| Recession velocity, v | 258 km/s | 273 km/s |
| Estimated distance, D | 12.00 mill. lt-yr | 12.70 mill. lt-yr |
| (average) | 12.40 mill. lt-yr |
|---|
z= (λm-λ0)/λ0
v= c*((1+z)2-1)/((1+z)2+1)
D= 3.26*v/H0 (million lt-yr)
(c: velocity of light, H0=70 km/s/Mpc)
|
This page shows you the observed spectral profile of the central part of M51.
The vertical lines in a taken spectral strip are originated from emission lines of atoms and/or molecules in atmosphere and light pollution.
The profile shows two emission lines of the H-alpha of hydrogen and the ionized nitrogen atoms.
A table in right has listed and indicated estimated distance to the galaxy from observed wavelengths.
The value can be calculated as about 12.4 million light years under an assumption that the Hubble constant of H0 has 70 km/s/Mpc.
|

