Observed Spectral profiles of M27


Upper: Profile of northern edge of M27, Lower: Profile of inner region

Date & Time: Jul 9 2016, 25:27 to 25:29 JST(+0900)
2 minutes exposed
Optical: Meade 25cm(10") Schmidt Cassegrain (f=2500mm, F10.0)
with SBIG DSS7 Spectrometer
Auto-guided with Meade LX200 Equatorial & Pictor 201 XT
Cooled CCD Camera: SBIG ST-402ME (Temp.: -15°C)
Location: Ooizumi, Hokuto city, Yamanashi pref.

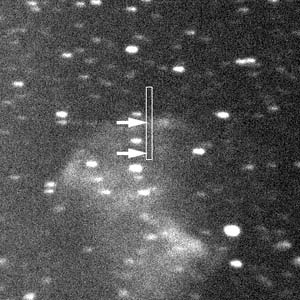
Upper strip pasted in each profile is taken spectrogram,
lower one is stretched 3-pixel-width & pseudo-colored image of individual parts.
Magnified profiles around Hα line
(Upper: Northern edge, Lower: inner region)
Solid circle: Observed intensities
Megenta: Gaussian curves of Hα & N II lines
Yellow: Overlay of the Gaussians


This page shows you the observed spectral profile of M27 with a spectrometer.
Two sets of spectrum profiles displayed in upper and lower of this page indicate the northern edge and inner region of M27, respectively. Individual observed positions are equivalent to arrows in right image.
As can be seen from the colored image, the inner round region of M27 has bluish color while the outer edge looks reddish. The spectral profiles can show the difference, the lines of ionized oxygen O III, positioned in blue-green, of the inner region have the highest intensities.
The magnified spectral profiles around the wavelength of H-alpha line are shown in the right hand sides of individual full-ranged profiles. We can detect a striking difference around H-alpha line. There are two neighboring emission lines from ionized nitrogen atoms of N II (at 6548Å and 6583Å). The N II lines are predominant in the northern edge of M27, while the profile of the inner region shows that the intensity of N II line looks being almost same intensities with that of H-alpha line.
The profiles show calculated intensities as solid curves fitted to observed ones under an assumption that individual emission lines have the Gaussian distribution with a standard deviation, ƒÐ=8Å. In case that the intensity of H-alpha line takes 100%, the relative intensities of two N II lines at 6548Å and 6583Å in the northern edge and inner region of M27 have 133%-330% and 50%-120%, respectively. It's considered that the differences in spectral profiles reflect the uneven distribution of gaseous matters in the nebula.

Slit position (North in up)


Close the window Copyright(c) 2016 by Naoyuki Kurita, All rights reserved.