| Date & Time: | Feb 25 2023, from 23:05 to 23:25 JST(+0900) |
| Composed 3 shots with 10 minutes exposed |
| Optical: | Meade 25cm(10") Schmidt Cassegrain (f=2500mm, F10.0) |
| with SBIG DSS7 Spectrometer |
| Auto-guided with Meade LX200 Equatorial & Lacerta M-GEN |
| Cooled CCD Camera: | SBIG ST-402ME (Temp.: -25°C) |
| Location: | Ooizumi, Hokuto city, Yamanashi pref. |
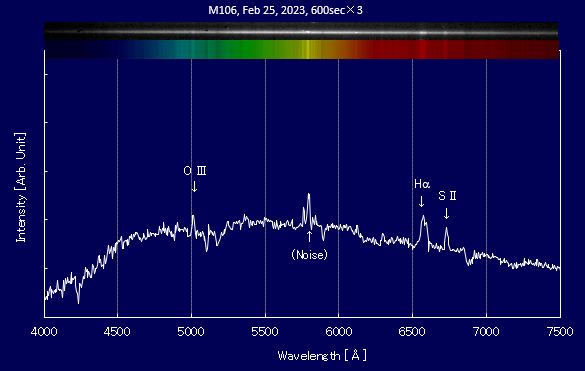
Upper strip: taken spectrogram, Lower strip: stretched 3-pixel-width & pseudo-colored image
| Emission line | Hα | O III | S II |
|---|
| Emission line, λm | 6574 Å | 5012 Å | 6734 Å |
| WL in literature, λ0 | 6562.9 Å | 5007 Å | 6730 Å |
| Red shift, z | 1.242×10⁻³ | 9.986×10⁻⁴ | 5.944×10⁻⁴ |
| Recession velocity, v (km/s) | 3.722×10² | 2.994×10² | 1.783×10² |
| Estimated distance, D (Mly) | 17.34 | 13.94 | 8.30 |
| (average) | 13.19 Mly |
|---|
z= (λm-λ0)/λ0
v= c*((1+z)2-1)/((1+z)2+1)
D= 3.26*v/H0 (Mly)
(c: velocity of light, H0=70 km/s/Mpc)
|
This page shows you the observed spectral profile of M106.
Derived from the interstellar gas within the central region of M106, one of the Seyfert galaxies, the profile exhibits emission lines,
including the Hα line from hydrogen atoms and lines from ionized oxygen.
The table on the right indicates the distances to M106 calculated from the redshifts of these wavelengths.
Assuming a Hubble constant of H0=70 km/s/Mpc, the estimated distance is approximately 13 million light-years.
While this is considerably less than the currently accepted distance (21 million light-years),
discrepancies may arise due to factors other than cosmic expansion affecting the recession velocities of nearby galaxies, leading to a significant margin of error.
|

